- Blog
- Tips & Guides
- 5 Metrics in Ecommerce ROI You Need For Your Next Scaling
5 Metrics in Ecommerce ROI You Need For Your Next Scaling
Advertising is key to the success of any ecommerce site. After all, without a strong marketing presence, how is your audience supposed to know what you have to offer? But simply throwing out adverts at random is no way to attract customers to your business.
So how are you supposed to know which advertising initiatives are successful, and are worth your time and money? Getting it right is important, as case studies estimate that as much as 40% of all media spend is wasted. With digital advertising fast becoming the primary method of advertising, this is a trend that will be costly and negatively influence your marketing ROI.
The best way to ensure your adverts are reaching the right people in the right places is through ROI reporting.
What is an Ecommerce ROI Report?
An ecommerce ROI report is a convenient way to see how much sales revenue is being generated by your marketing and influencing your bottom line. All too often, digital advertising campaigns have their success measured by how much traffic they’ve generated for a particular website, or how many “likes” or “shares” they have received.
The ROI, or return on investment report will show you how much has been earned in profit for each dollar spent on marketing efforts and acts as an indicator of customer lifetime value. This is a much more relevant way of measuring the success of an advertising campaign.
Vanity metrics, such as social media interactions, may look great on paper, but they are largely irrelevant if those interactions don’t translate into actual sales and you’re unable to get a handle on conversion value.
However, ROI reporting is rarely as simple as it sounds. If you want to track the return on investment of a particular campaign and attribute a dollar value to its success, there are many metrics that need to be tracked and measured. Often this data will be spread across multiple platforms.
There are two main ways to report the ROI of marketing:
- Gross ROI is a simple calculation of how much has been spent on advertising, measured against how much revenue it generates. For example, an advertising campaign that costs $200, but has generated $1000 in sales, would have a gross ROI of $5, as for every dollar spent, $5 has been generated.

If you’re using this metric to measure the success of a campaign, the higher the ROI the better. A 5$ ROI would mean that you’ve made back five times what has been spent on advertising, which sounds like a successful campaign, doesn’t it? However, gross ROI reporting doesn’t always give the full picture.
- Net ROI, on the other hand, gives a more accurate representation of how much has been generated in profit. This is because the calculation takes into account a variety of other costs, such as manufacturing fees, shipping costs, communication charges, such as the cost of network phone numbers, among others. This results in a much more complicated calculation.
Looking at the same campaign, before we calculate the ROI, we must take into account any other costs which will affect the profit of the campaign. Let’s say the cost of goods and shipping was $100, and the payroll expenditure was another $100. This must be subtracted from the total sales first.
$1000 – $100 = $900
$900 – $100 = $800
Then we can subtract the cost of advertising, $800 – $200 = $600.
Then we can divide the profit generated by the cost of advertising, which will give the amount of net profit generated by each dollar spent, in this case, $3.

Although this figure is obviously lower than the gross ROI, it is a much more accurate reflection of the return on investment, (a $3 return on every $1 spent would be classed as extremely successful for any advertising campaign). In fact, anything above $1 generated by every dollar spent would be classed as a worthwhile campaign.
Producing an ROI Report
There are numerous metrics that can form part of an ROI report. What your ROI report looks like will be determined by which of these metrics are most important to your company’s benchmarks. However, it is helpful to gather data from all areas possible, in order to build the most complete picture of your returns.
Gathering this data may seem like a complicated and time-consuming task, but there are many tools available to make it easier and more efficient. We’re going to take a look at some of the main methods that can be used when producing an ROI report.
Conversion Tracking on Ad Platforms
This is one of the most simple approaches to reporting ROI, but it can be beneficial if you want a general overview of how your business is being impacted by ads on a particular platform. Many platforms will offer you ways to track conversions from within the platform itself.
Google Ads, for example, offers easy-to-follow steps for tracking static conversions from your different adverts. These conversions can be customized, so you can dictate exactly what is classed as a successful conversion to your company.
For example, having the conversion event tied to a “Thankyou” page after a customer has made a purchase, will mean that only website visits which result in sales will count as conversions. Having the event tied to a landing page would result in every visitor to your website through the ad being classed as a conversion, regardless of if they made a purchase or not.
Static conversions are helpful for companies that only offer a small number of goods and services through their website. Ecommerce sites that offer a large range of products at a range of price points, however, will need a more complicated method of conversion tracking.
Tracking conversions with dynamic values allows companies to more accurately value what each conversion is worth to their business. Instead of assigning a single value for each conversion that’s tracked, a separate value must be set up for each product on offer.
Some selling platforms offer templates and instructions for setting this up with Google Ads, but smaller platforms or custom ecommerce stores may need to utilize custom code on their own websites in order to track the varying prices.
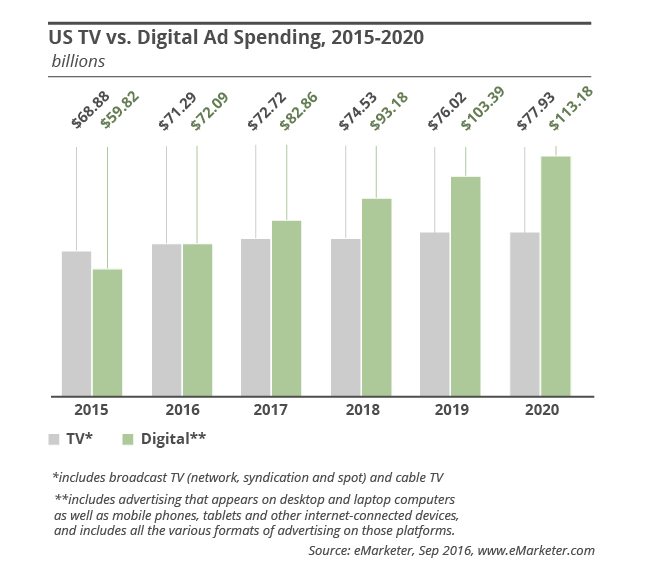
One of the drawbacks of using conversion tracking to measure ROI is that it doesn’t always provide a full picture of a customer’s journey to making a purchase. For example, although they may have clicked through a Google link, they may also have been searching for a particular product or your company in particular thanks to an advert seen elsewhere, such as on social media or in an email.
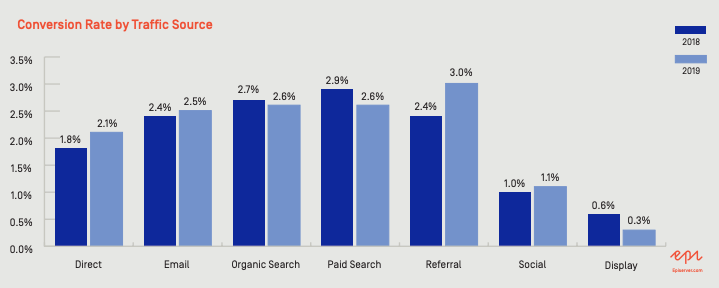
Image Source
Although there may have been several contributing factors to that customer making a purchase, the Google ad would receive all the credit, thereby producing impressive, yet inaccurate, ROI figures. Third-party applications can be helpful in tracking data from various sources in order to provide a fuller picture when reporting ROI.
Set Up Analytics for Your Website
Another option for attributing conversions is to use website analytics software to further inform optimization. This will provide you with data about where the visitors to your website come from, and how they have interacted with your site.
It will also be able to show you more niche statistics, such as your bounce rate. This is the number of visitors that have come to your website but left again without clicking through to any other pages. The average bounce rate for ecommerce as viewed through the lens of Google Analytics can be quite high, so if your bounce rate falls, you know you’re attracting the right kinds of customers who are more likely to buy from you.
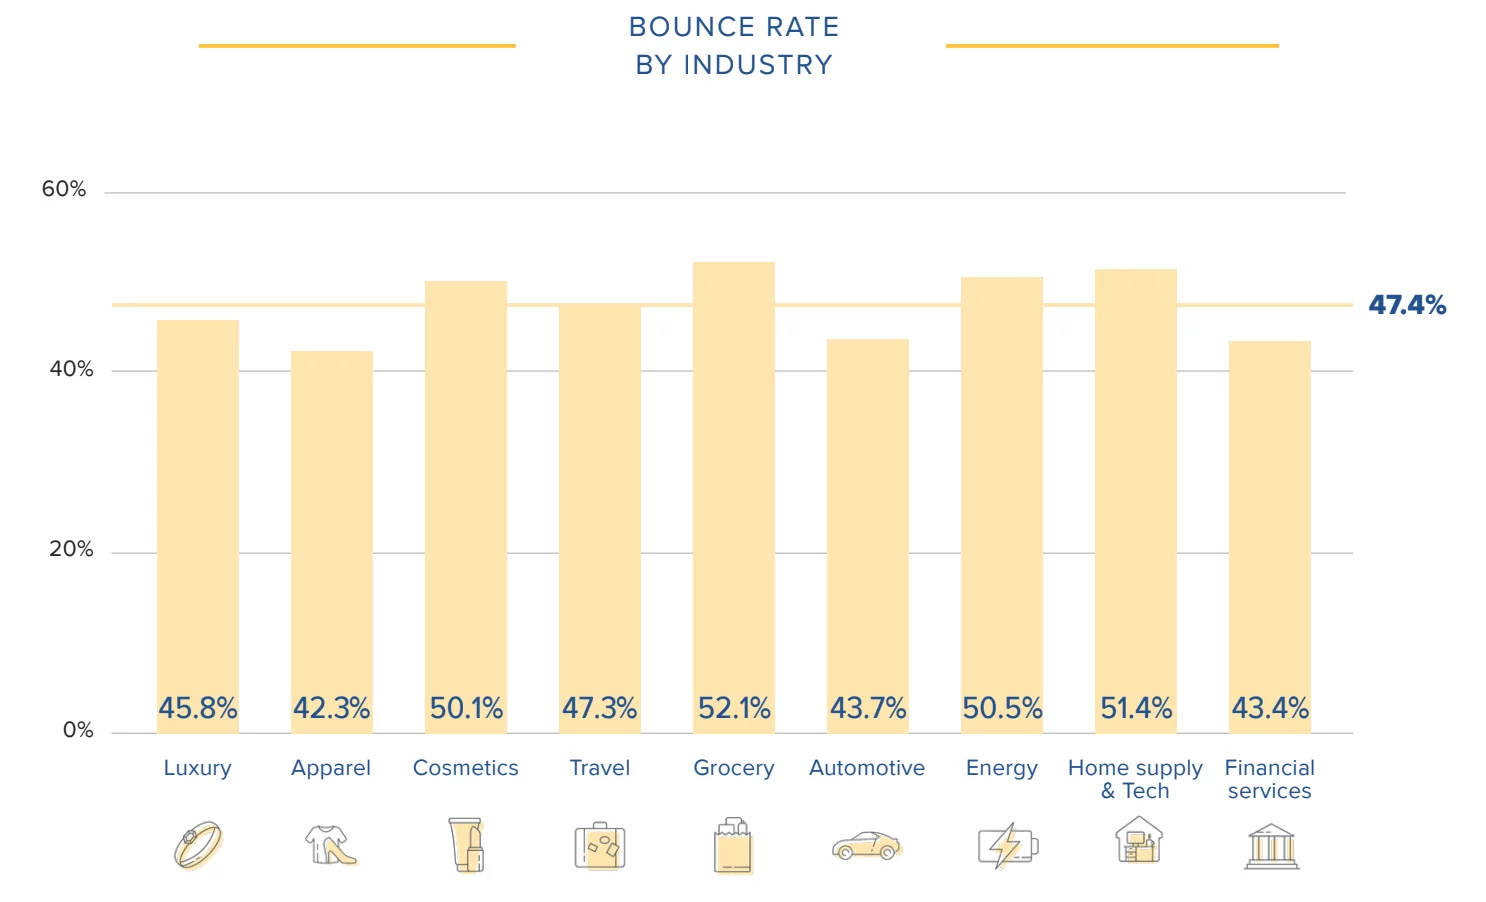
Image Source
Most website analytics dashboards are great at showing you a large variety of data points, but this alone will not tell you what has been responsible for generating revenue for your site. In order to gather this information, you would need to set up specific conversion goals, so you can determine when a purchase has been made, and how the customer arrived there.
There are a variety of third-party services available to make the process of collating data from across different advertising services simpler.
Many ecommerce platforms will have ready-made plugins or extensions that utilize automation in order to aid your analytics software to track conversions. Once you’ve tracked the method by which each paying customer arrived at your website, you can assign monetary values to their transactions, and therefore calculate how much revenue has been generated by different advertising methods.
Benefits of an Ecommerce ROI Report
Having an ecommerce ROI report to refer to has several benefits for any business. This is why the majority of marketing companies measure ROI at least quarterly.
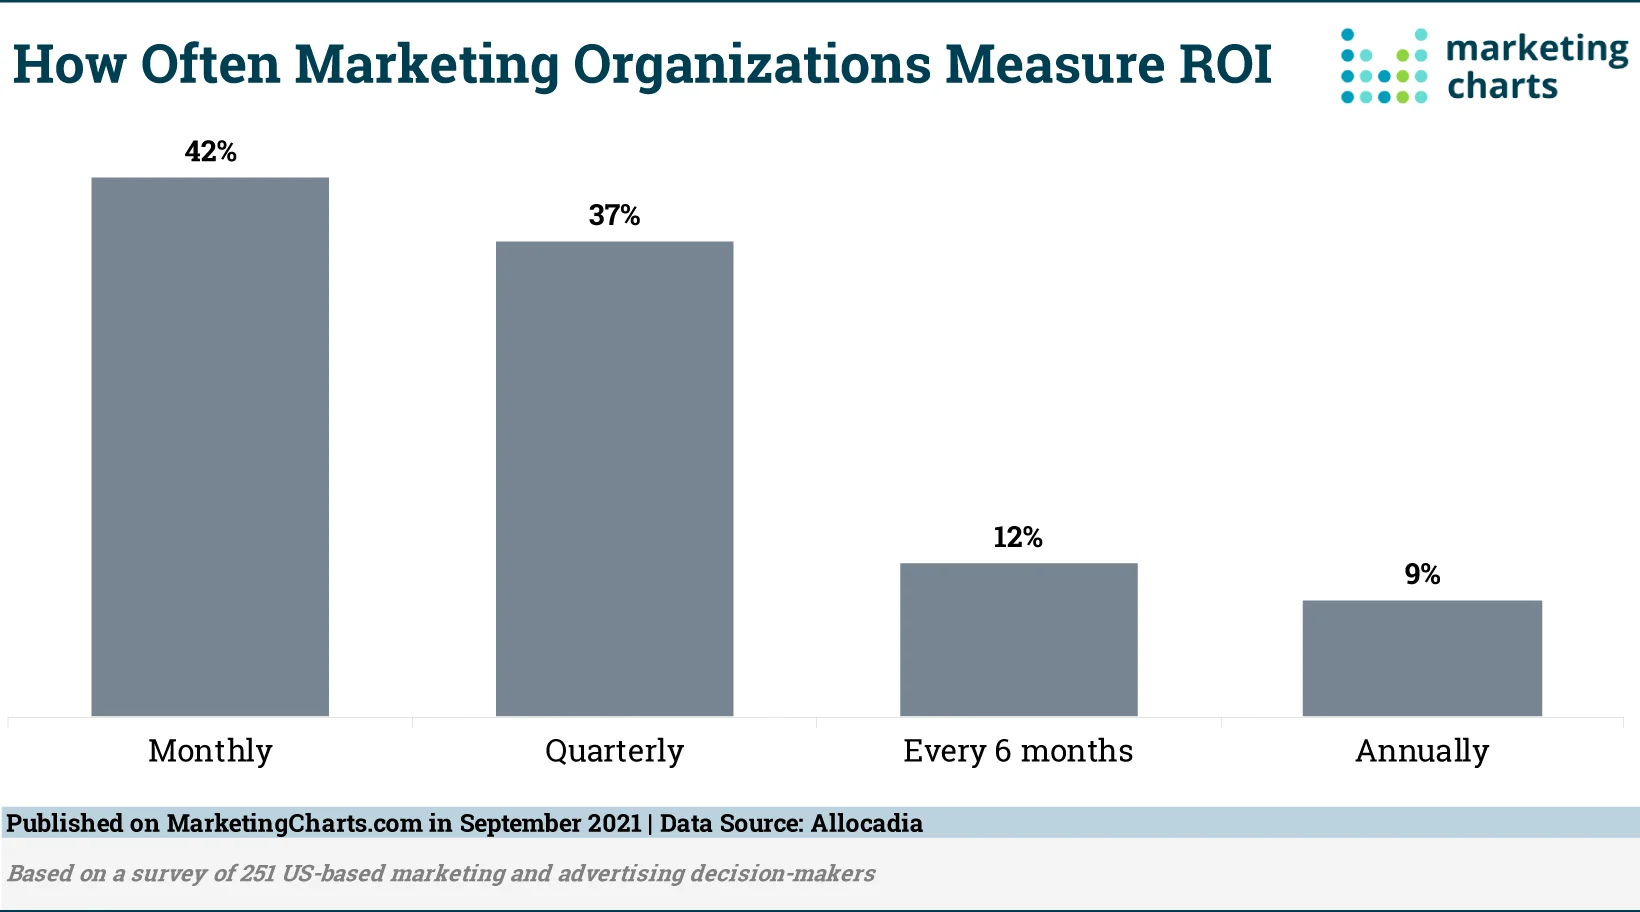
Image Source
Being able to see what revenue is being generated by your advertising gives you an idea of what is working, and what isn’t. This allows you to focus more on the kind of marketing strategies that generate conversions for your website, and stop wasting money on advertising that has a lesser impact.
ROI reports can also help provide more accurate estimates for both projected advertising costs and returns. This makes financial planning a lot more accurate and helps when calculating commissions. It also supports justifying future advertising budgets. In fact, statistical analysis can help greatly when working to develop any kind of budget.
If you can demonstrate how much certain types of advertising have generated in profit previously, then you can be much more confident about how well they’ll perform in the future when planning your next campaign. This will also help when coming up with future advertising budgets.
Finally, the data gathered in order to draw up an ROI report for ecommerce marketing can also be used to great effect by other areas of the business. For example, by comparing the percentage of visitors against the number of email or telephone inquiries you have received, you can make judgments about how robust your customer service department needs to be.
If a lot of customers have visited your site but wish to know more before purchasing, it could be worth investing in cloud PBX systems, or similar technologies, to lighten the load for customer service teams during successful ad campaigns.
5 Important ROI Report Metrics You Should Include
There are many metrics that can be included on an ROI report, and the ones are used will depend on which marketing channels have been employed, and which results you wish to highlight. Here we’ll take a look at five of the most influential metrics, what results they show, and the reasons why they should be considered for inclusion in any ROI report.
1. Total Traffic Generation
Total traffic generation is exactly what it sounds like; it shows how many visitors have been driven to your website by all the advertising across the web. If your business relies on increasing customer acquisition, then a large traffic generation figure will be important. After all, more traffic means more conversions on average.
While big numbers for total traffic generation will appear impressive, they’ll not always be helpful in calculating ROI. For this, the more you can pinpoint what kind of traffic your website has received, the better. For this reason, it can be beneficial to use your website analytics software to filter out traffic by type. These include:
a. Direct Traffic
This metric will not always be helpful for calculating ROI, as it applies when a customer has inputted a website’s URL directly into their address bar. As the bulk of digital marketing will encourage new customers to follow links to your website, there will be few instances where digital marketing has resulted in direct traffic.
b. Social Media Traffic
Social media traffic applies to customers who have found your website through Facebook ads, sponsored tweets on Twitter, and Instagram posts. This will be important when analyzing the impact of social media campaigns, and collaborations with outside agencies or influencers.
c. ferral Traffic
Any traffic which comes from a third-party, non-search engine site will be referral traffic. This will include traffic from guest blog posts, reviews, and product comparisons that appear on other websites. This will also demonstrate how effective any content marketing has been for your business.
d. Email Traffic
Email traffic will be customers sent to your website directly from your email marketing campaigns. This could also be further analyzed by what type of email brought them to your site. For example, are emails containing discount vouchers more influential than those advertising products at reduced prices, and if so, which is more cost-effective? Email marketing is traditionally much more economical than other forms of digital advertising, and so is well worth monitoring.
Image Source
e. PPC Traffic
PPC, or pay-per-click, traffic, measures visitors who have been directed to your site through Google Ads or adverts on similar platforms. Examining this kind of traffic will allow you to quickly determine whether what you’re paying other companies for advertising space is good value for money.
f. Organic Traffic
Organic traffic covers any customers who found your site through search engine results, without being directed by paid-for adverts. Organic traffic will be directly linked to your website’s attempts at SEO. Better SEO will mean more search results, which will mean more organic traffic.
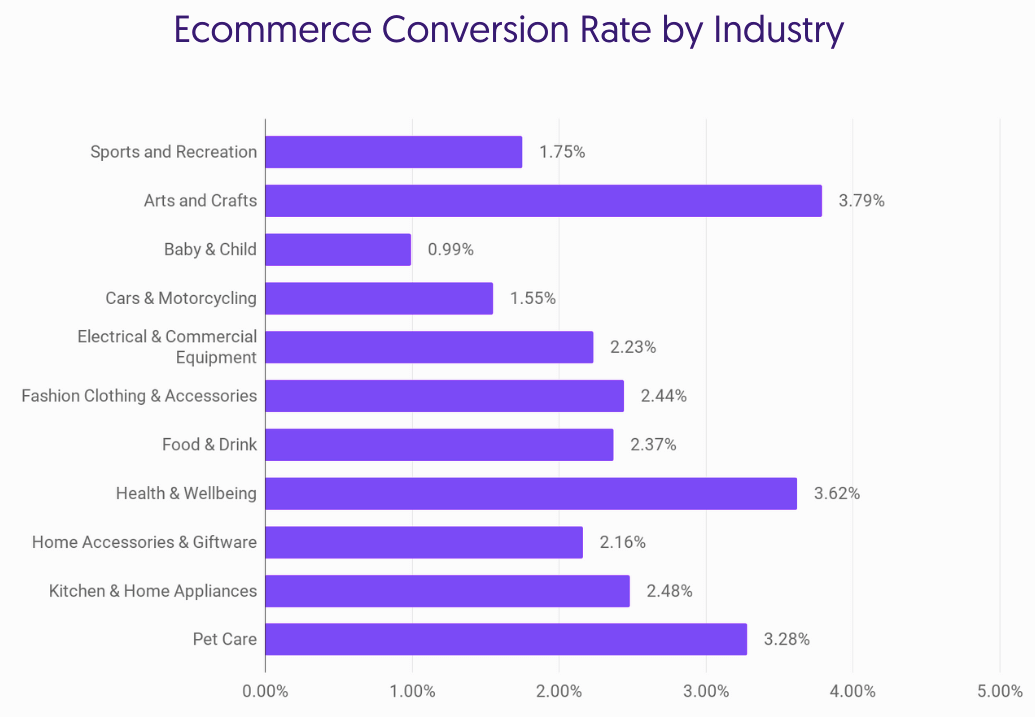
2. Conversion Rates
As previously mentioned, conversion rates will be one of the key metrics examined by any ROI report. Tracking how many generated leads have been converted into paying customers gives a much clearer picture of how much money has been generated by a marketing campaign, rather than how many visitors have come looking at your website, but not necessarily bought anything.
However, conversion rates do not simply refer to customers who have already parted with their cash. You could also measure how many leads have been converted into sign-ups, meaning they have joined your mailing list and given you their contact details. Although these leads have not yet been fully converted, they have been driven further down your sales funnel and could provide future sales.
3. Visit Value
Once you’ve established how much traffic has been generated, and what number of those visits resulted in a conversion, you can work out the value of each visit. This is simply calculated by taking the amount of traffic over a specified period of time and dividing it by the number of conversions in the same time period.
If you wish to put a monetary figure on the value of a visit, all you have to do is link back how much a particular customer put in their cart and checked out with. In this regard, the visit value becomes the total number of visitors to the site in any given time period, divided by the sales made during that period. This will assign an average spend of each visitor, which you can weigh up against other metrics such as your conversion rate.
4. Revenues and Marketing Costs
It’s important to consider the actual cost of marketing when preparing an ROI report. As previously covered, omitting this data from the calculation results in a skewed figure, which doesn’t accurately reflect exactly how much has been made in profit by your marketing campaigns.
By subtracting marketing costs from your generated revenue before dividing by the cost of marketing, you can get a more accurate picture of exactly how much each dollar of marketing has earned you. Otherwise, you’ll be working under the false assumption that your marketing efforts have simply paid for themselves.
Marketing spend will differ greatly depending on the types of advertising you have invested in. Many businesses are embracing less traditional types of marketing, such as brand partnerships, which are mutually beneficial, and give access to previously untouched customer bases.
5. Average Order Value (AOV)
The average order value is calculated by dividing the amount of revenue generated by the number of orders placed. This will sometimes be referred to as “cart spend” or “basket spend”. This is helpful when trying to attribute value to marketing as it can be used to track increases and decreases in average spend against specific advertising campaigns.

A high average order value would indicate that each customer has been persuaded to spend more on your website. Comparing these figures against which campaigns were running at the time can help you distinguish which methods of advertising have been most influential.
Couple this with the analysis of where those customers saw your advert, and you can quickly see a picture of which customers are likely to spend the most and where they are easiest to reach, allowing you to focus in on the most profitable areas for future campaigns.
It’s worth remembering that, as with all averages, the data can be distorted by exceptionally large or unusually small order totals, which could be the result of promotions such as discounts or multi-buy offers.
Takeaways
ROI reporting is clearly an important and effective way to measure the success of your digital marketing campaigns. The benefits are numerous, from being able to positively influence future advertising to assisting with budgeting.
ROI reports themselves can take many forms, but the key factors which make a helpful report often share similarities. Be mindful of which metrics are reported, and how much weight each metric carries. More in-depth calculations produce reports with greater insights and give you more data to analyze.
Embrace the notion of ROI reporting, see how successful your marketing has been so far, and marvel at how much more so it can be in the future.
Frequently Asked Questions
1. What are the most critical metrics for accurate eCommerce ROI reporting?
To accurately report on eCommerce ROI, you need to go beyond just cost and revenue. Key metrics include Customer Acquisition Cost (CAC), Average Order Value (AOV), Customer Lifetime Value (CLV), and conversion rates. For a comprehensive look at the metrics that drive partner program success, refer to our detailed guide on 10 Partner Marketing KPIs You Should be Measuring.
2. How can I actively improve my eCommerce ROI?
Boosting your eCommerce ROI involves a multi-faceted approach, from optimizing your SEO and leveraging social commerce to strategically using video content. Implementing the right tactics can significantly improve your return on investment. Explore actionable strategies in our article on 9 Tips to Increase eCommerce ROI.
3. What is the role of attribution in measuring eCommerce ROI?
Attribution is crucial for understanding the customer journey and identifying which marketing channels and campaigns are driving conversions. This insight allows you to allocate your budget more effectively and maximize your overall ROI. To learn more, dive into our Comprehensive Guide to Mobile Attribution.
Written by
John Allen is a driven marketing professional with over 14 years of experience, an extensive background in building and optimizing digital marketing programs across SEM, SEO, paid media, mobile, social, and email, with an eye to new customer acquisition and increasing revenue.