[IMAGE CREATED BY AUTHOR]
Conversion Rate
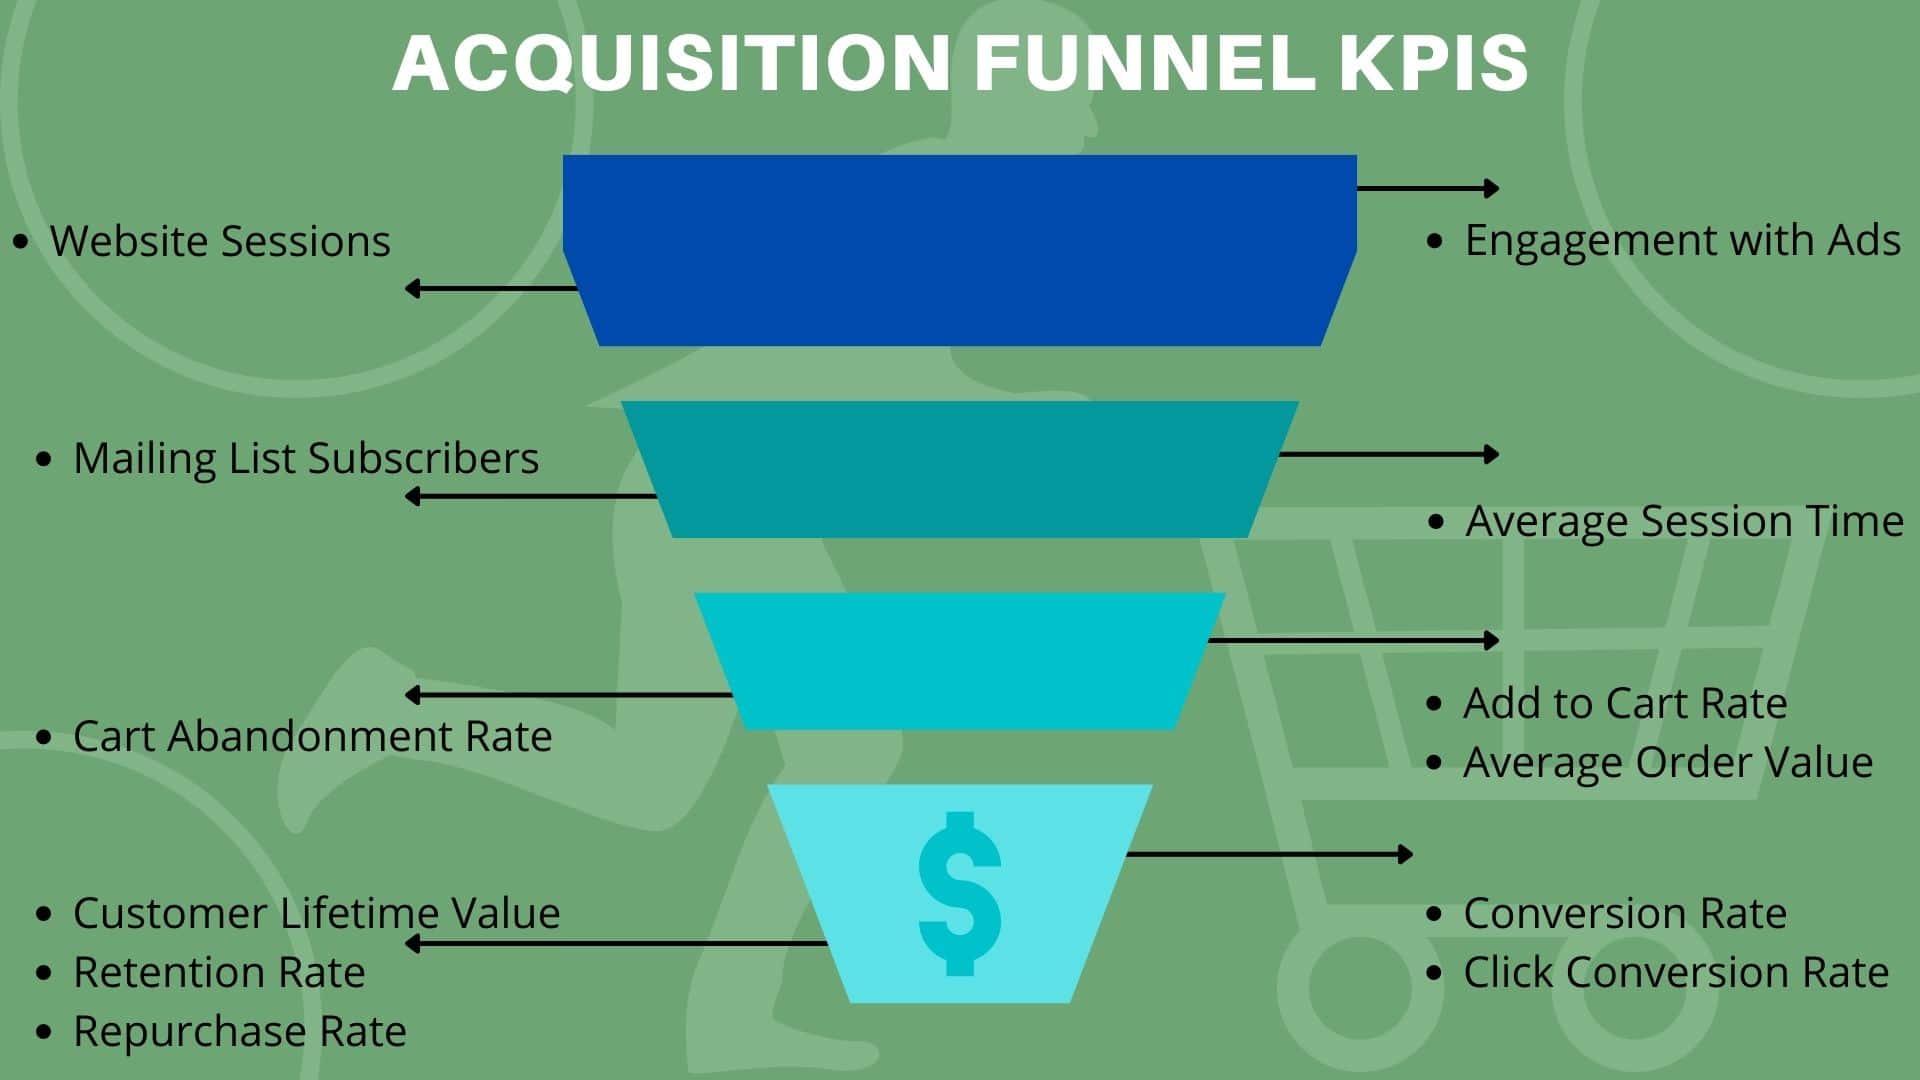
Simply put, your conversion rate is the percentage of visitors to your site who take the action you want them to—in most cases, making a purchase. However, depending on what you’re measuring there are many “micro-conversions” you may also wish to take into account.
To work out your average conversion rate over a specific time frame, simply divide the number of conversions within that time frame by the total number of site visitors during the same period. Multiply this result by 100 to get your percentage conversion rate.
For example, a site with 500 visitors and 80 conversions in a month would have a conversion rate of 16% for that month.
Ecommerce business platforms such as Shopify can automatically show your monthly and annual conversion rates as key metrics on your dashboard.
Click Conversion Rate
Calculating your conversion rate is simple at first glance, but what if the same customer comes back to make several separate purchases? Do the purchases count as a single conversion or multiple successes? To understand the difference, marketers talk about click conversion rate.
This counts the total number of visitors who convert, rather than the total number of conversions. While your click conversion rate doesn’t account for repeat customers in the same way your standard conversion rate does, it can be instrumental in understanding the effectiveness of your marketing tactics in bringing customers on board.
To work out your click conversion rate over a certain time frame, divide the total number of visitors who converted during that time by the total number of visitors, then multiply the result by 100.
Cart Abandonment Rate
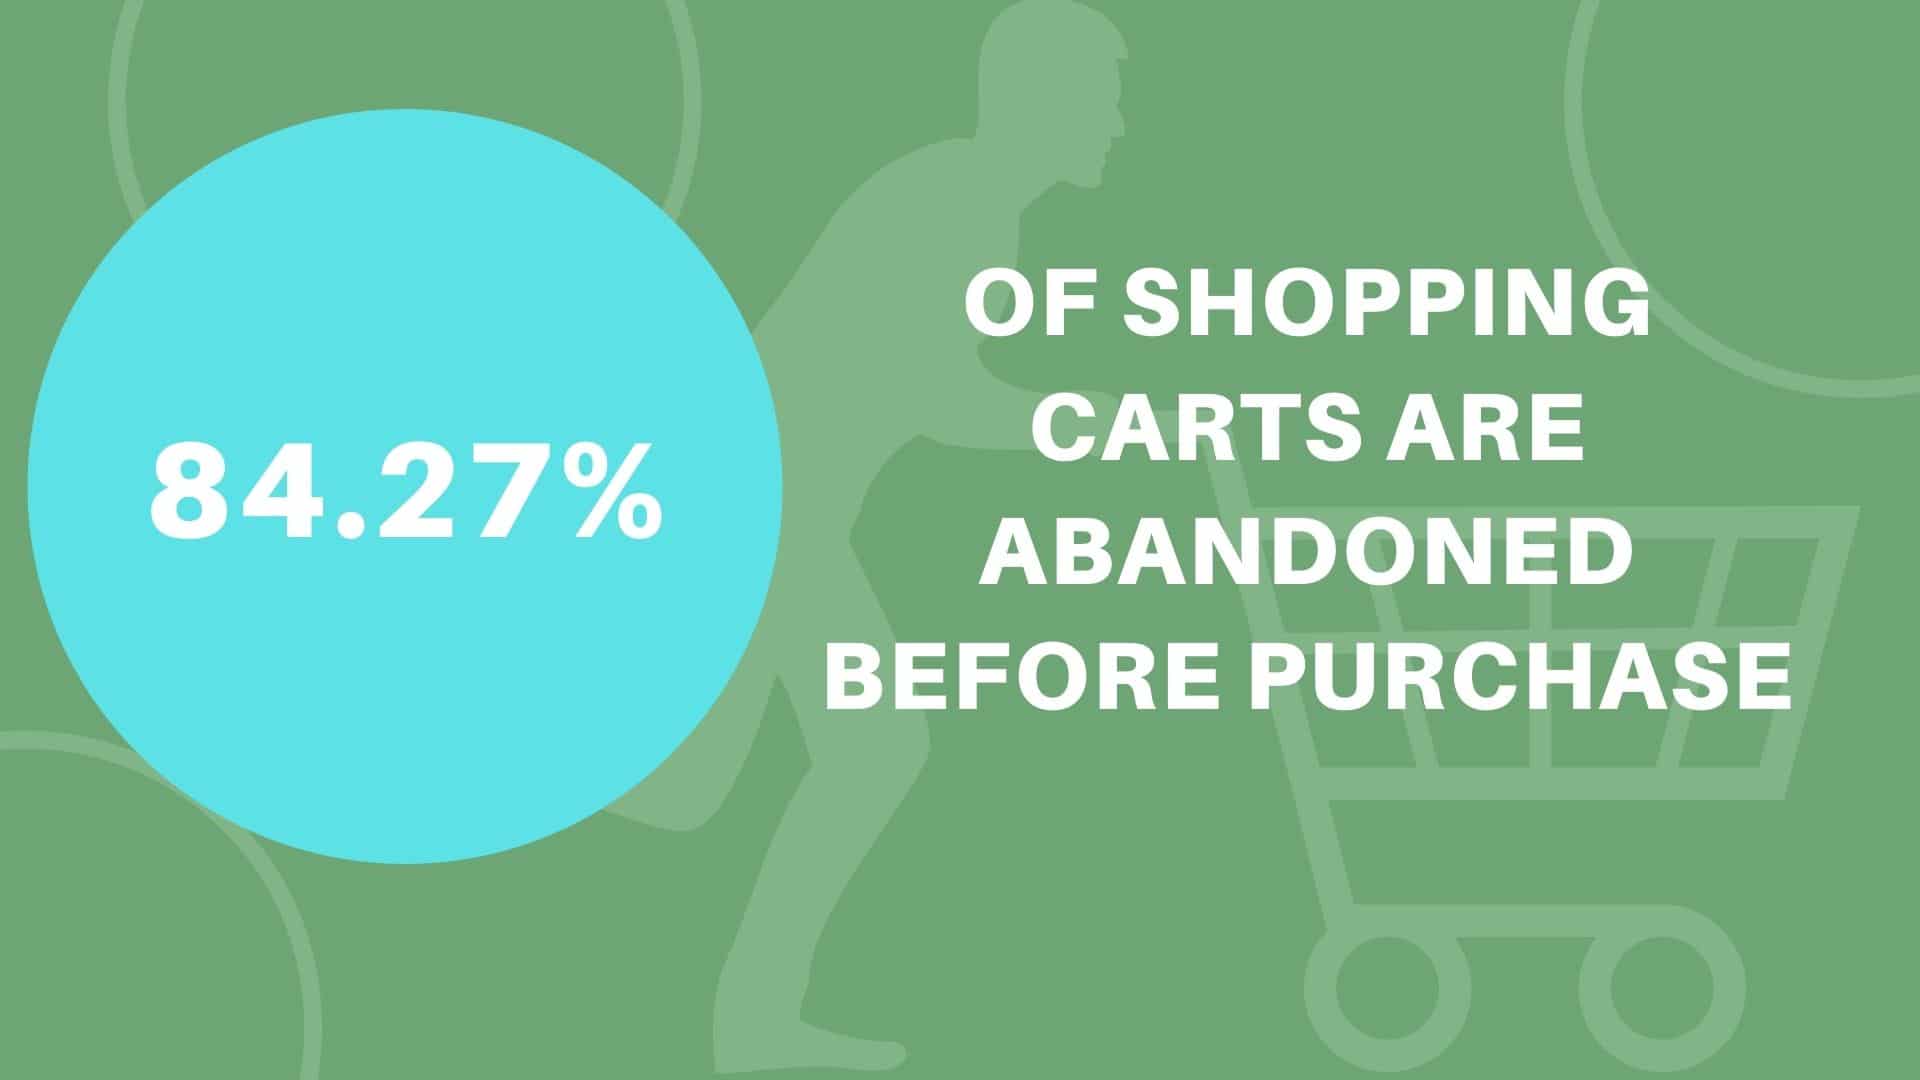
This refers to the percentage of shoppers at your ecommerce store who add items to their carts but abandon those carts before completing the purchase. This is very common customer behavior, as many customers add items to their carts simply to keep track of them while still in the consideration stage.
Other customers may abandon their carts due to new information at the bottom of the funnel, such as a high shipping rate, which causes them to change their minds. Alternatively, the purchase flow could be a deterrent if it requires shoppers to sign up for an account or complete lengthy forms.
To work out your cart abandonment rate, divide the total number of completed purchases by the total number of shopping carts created during the same period. Subtract your result from one, then multiply the result by 100.
For example, if 300 shoppers created carts on your store, but only 60 completed their purchases, you will have an abandonment rate of 80%
Add to Cart Rate
Your add to cart rate denotes the percentage of shoppers who place one or more items in their cart during a session. By monitoring this metric, you can better understand how many people have reached the midpoint of your sales funnel. You can also gain a picture of the success of your product choices, marketing, and onsite user experience.
By comparing your add to cart rate with your cart abandonment rate, you can also consider where in your sales funnel you are experiencing setbacks.
To devise your add to cart rate, divide your total number of sessions by the number of sessions with at least one cart item present.
Customer Lifetime Value
Customer lifetime value, or LTV, refers to the total revenue a company makes from a single user. In short, it is the total benefit that each customer will bring to your brand throughout its predicted lifespan. By exploring this metric, you can identify the most valuable customer segments and dedicate more time and resources to these.
You can also keep an eye on your LTV to ensure that your retainment efforts are working. The higher your LTV, the more customers are becoming loyal to your brand. If this figure makes a sudden leap, it may indicate that a loyalty rewards program or mailing list is yielding results.
To work out your LTV, calculate your average purchase value. Then multiply that figure by the average purchase frequency rate to determine your customer value. Then, calculate your average customer lifespan—that is, the length of time a customer brings value to your brand—and multiply the two figures together.
Average Order Value
Your average order value is the mean amount spent each time a customer makes a purchase. Increasing AOV is a common long-term goal for companies, and can be achieved by guiding customers toward more expensive items or more items in total per order.
The ideal customer is one with high AOV. This makes the metric useful in understanding whether you’re bringing the right kinds of customers to your site with targeted advertising.
To work out your AOV, simply divide your total revenue by the total number of orders.
Retention Rate
Your retention rate is the frequency with which repeat customers return to your store and make further purchases. This is an important metric for analyzing LTV and customer loyalty, and could help you work out the best ways to improve retention—from a wider range of products to a better loyalty program.
To work out your retention rate, divide the number of users who have made multiple purchases by the number of users who have made a single purchase.
Repurchase Rate
This measures how many people who return to your online store within a certain time frame. For example, a month after their initial purpose. You can also define this rate by the number of customers who rebuy the same item.
This is a great metric for understanding whether your retention strategies are successful. Especially if you are selling a consumable product that needs to be periodically repurchased. In this case, a high repurchase rate shows that your customers have tried your product, and are now choosing it over other brands.
Returns
While a high conversion rate may be a boost to your confidence, make sure you take your rate of returns into account as well. Track the number of return rates within a certain period and multiply them by your expected sales volume over the coming year to gain an impression of how many products are being sent back.
Ecommerce Acquisition Funnel Strategies
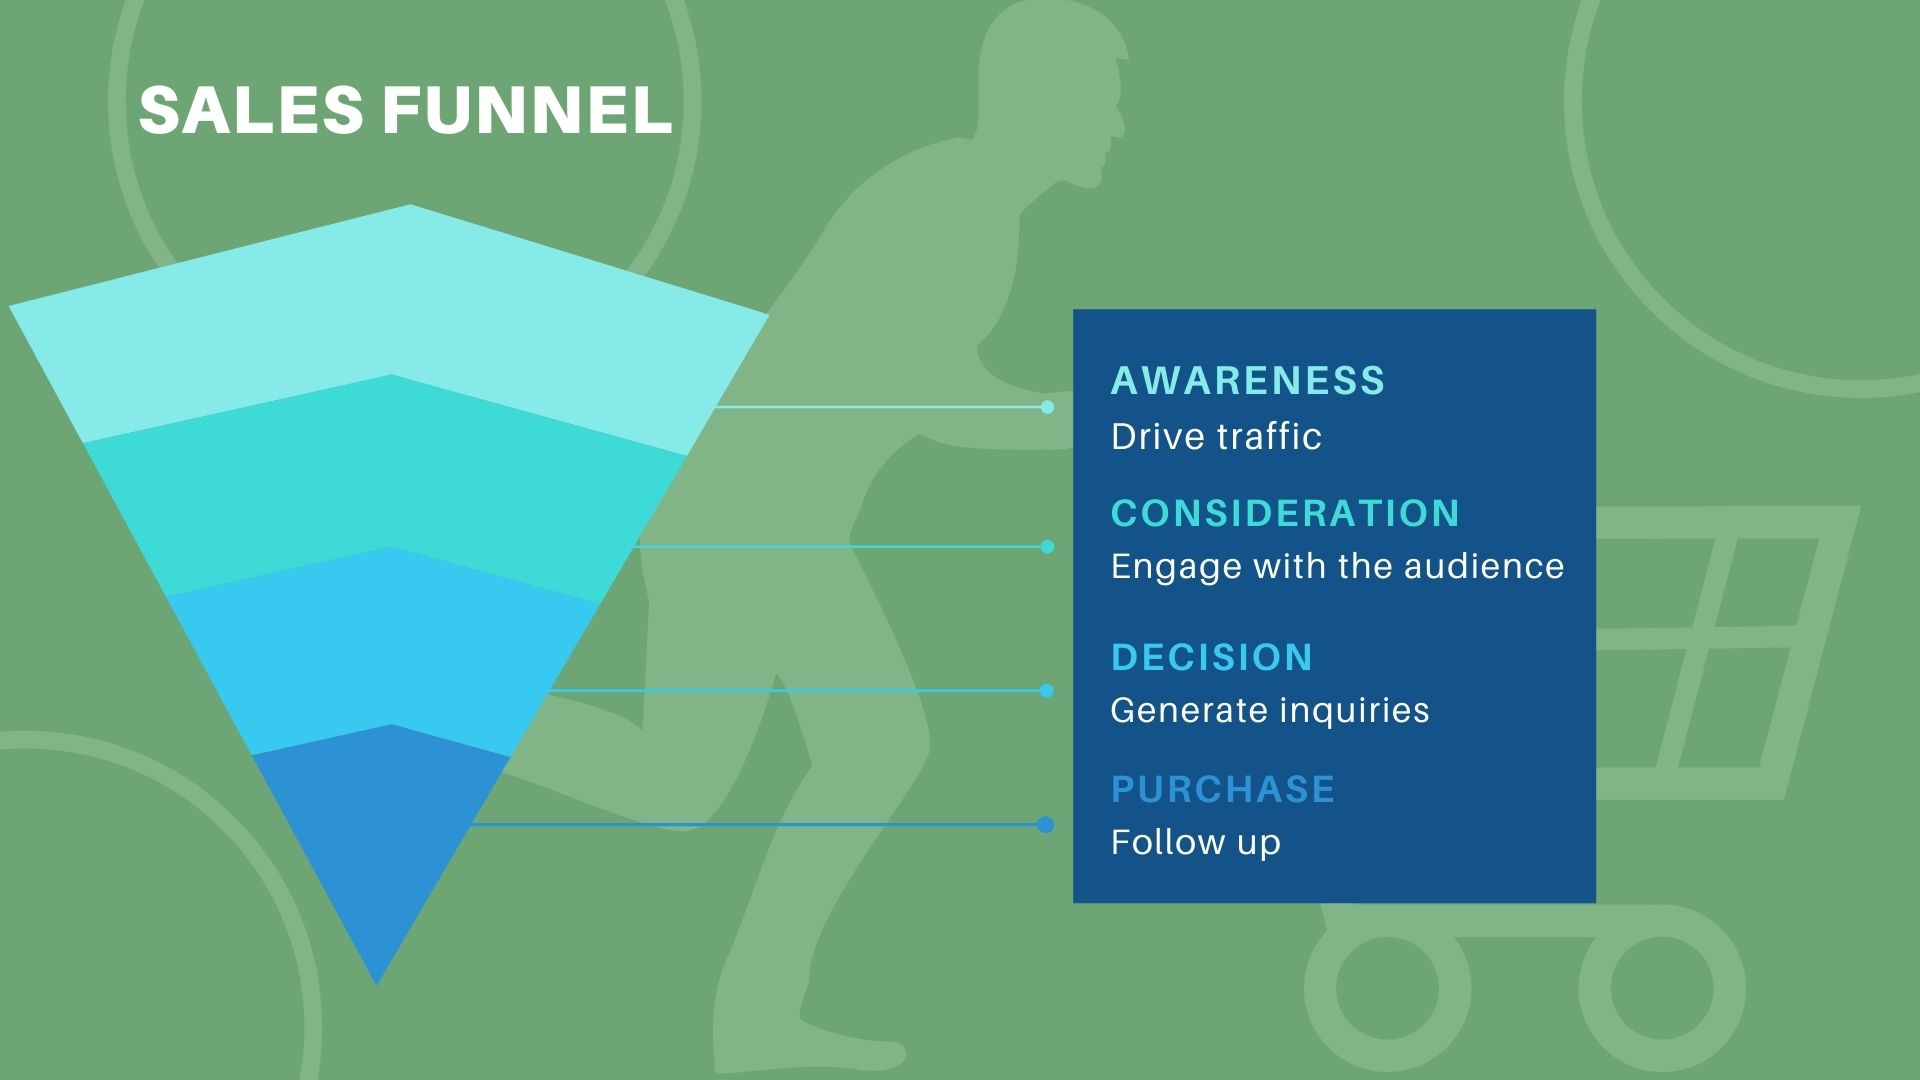
One question remains: How can you optimize your sales funnel flow and determine a good conversion rate for your business? Start by using the structure of your funnel to determine which areas of your strategy are doing well, and which could do with some work.
For example, if you’re losing a lot of customers in the awareness and consideration stages, take a look at your digital marketing efforts. If there’s a lot of drop-off lower down in the funnel, consider how your content marketing or check-out process can be optimized.
Below are some key ways in which you can keep consumers moving through the funnel, all the way to your goal.


