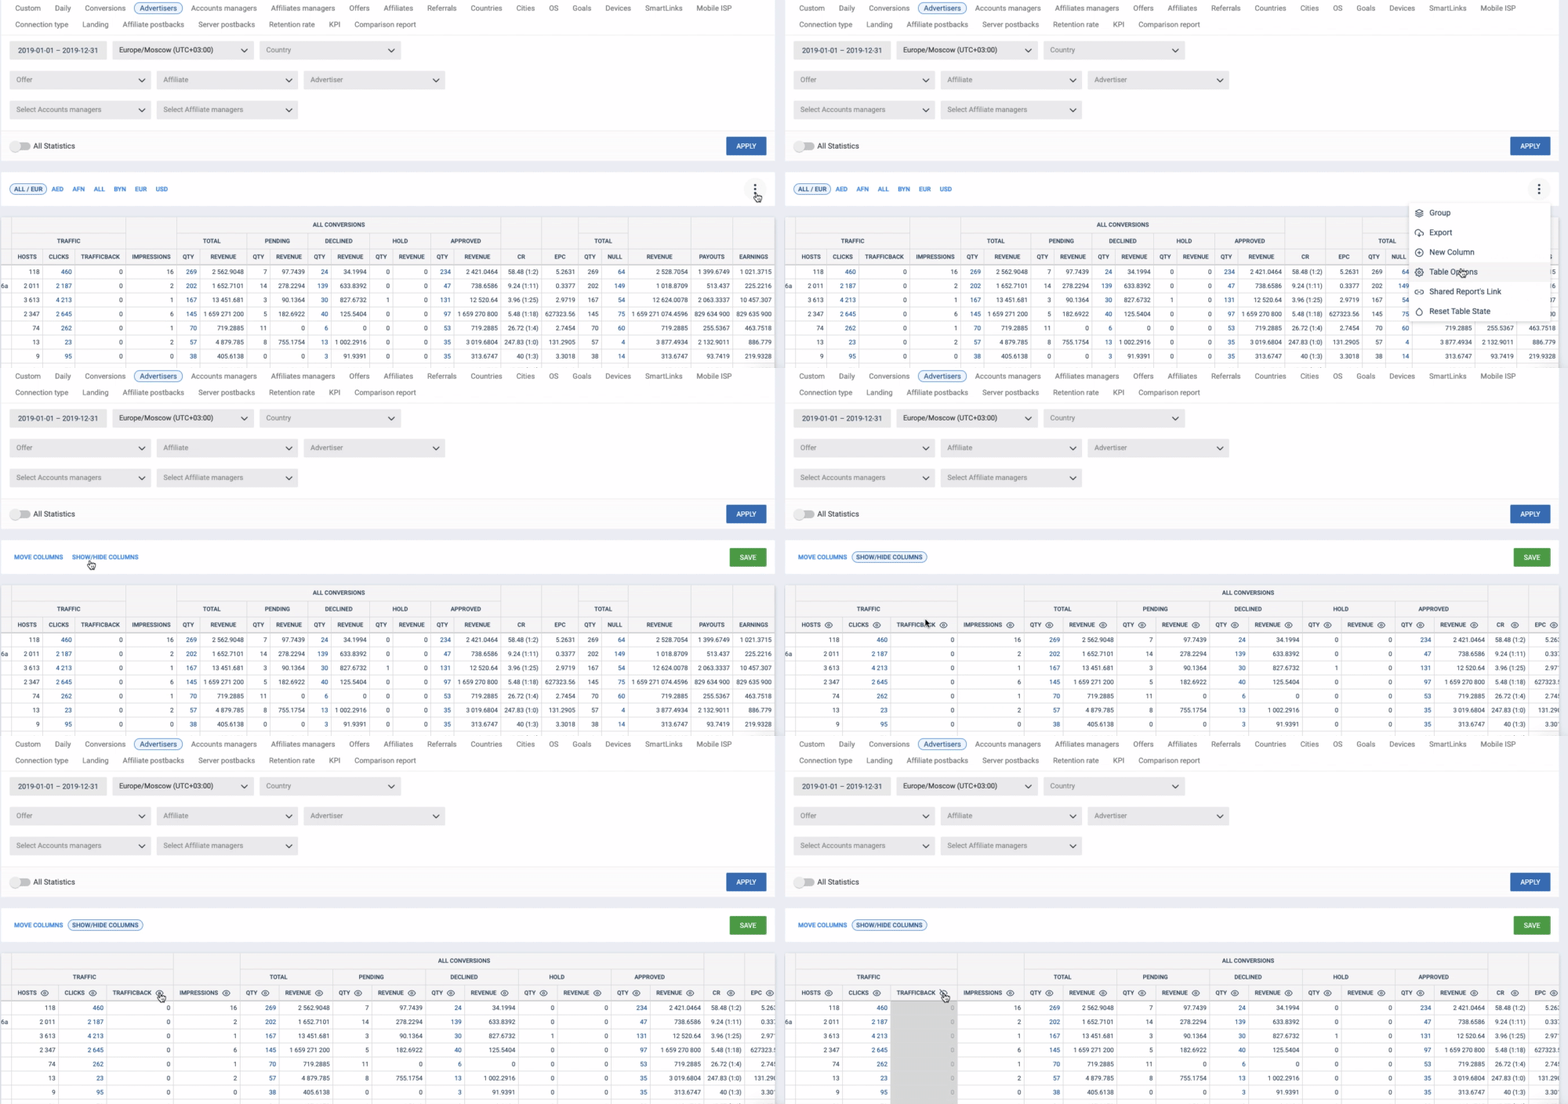
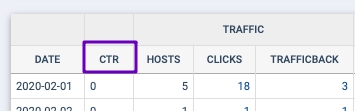
New columns can be removed, and default ones can be hidden.
Renaming of Default Column Titles
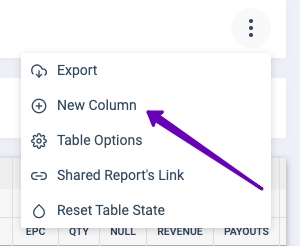
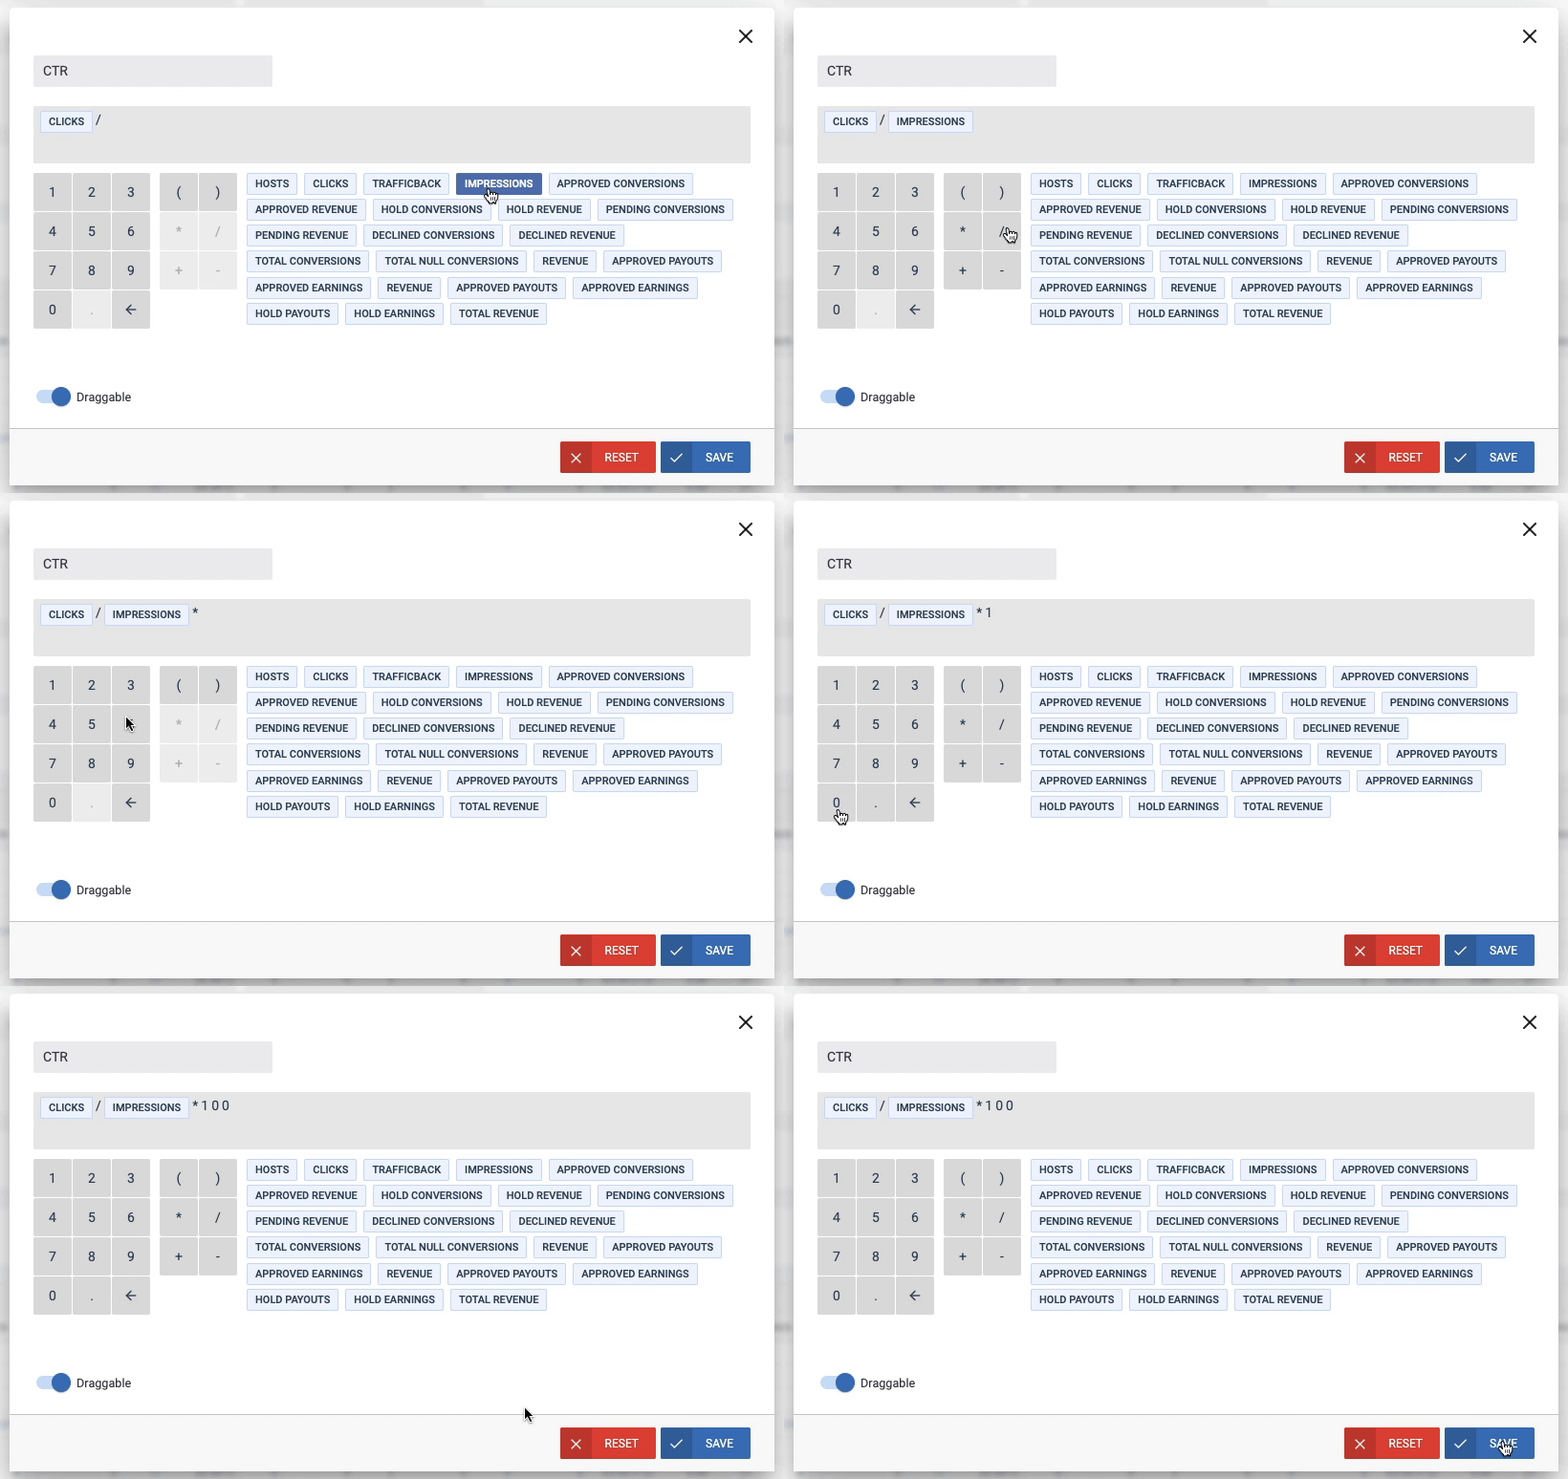
In case users need to rename any of the default columns, they can hide the existing column and create a new one with the help of the Calculator widget.
Drilldown Reports
The report includes a unique visualization of multiple data groupings for a better understanding and analysis. This report breaks down the statistics in accordance with various additional parameters.
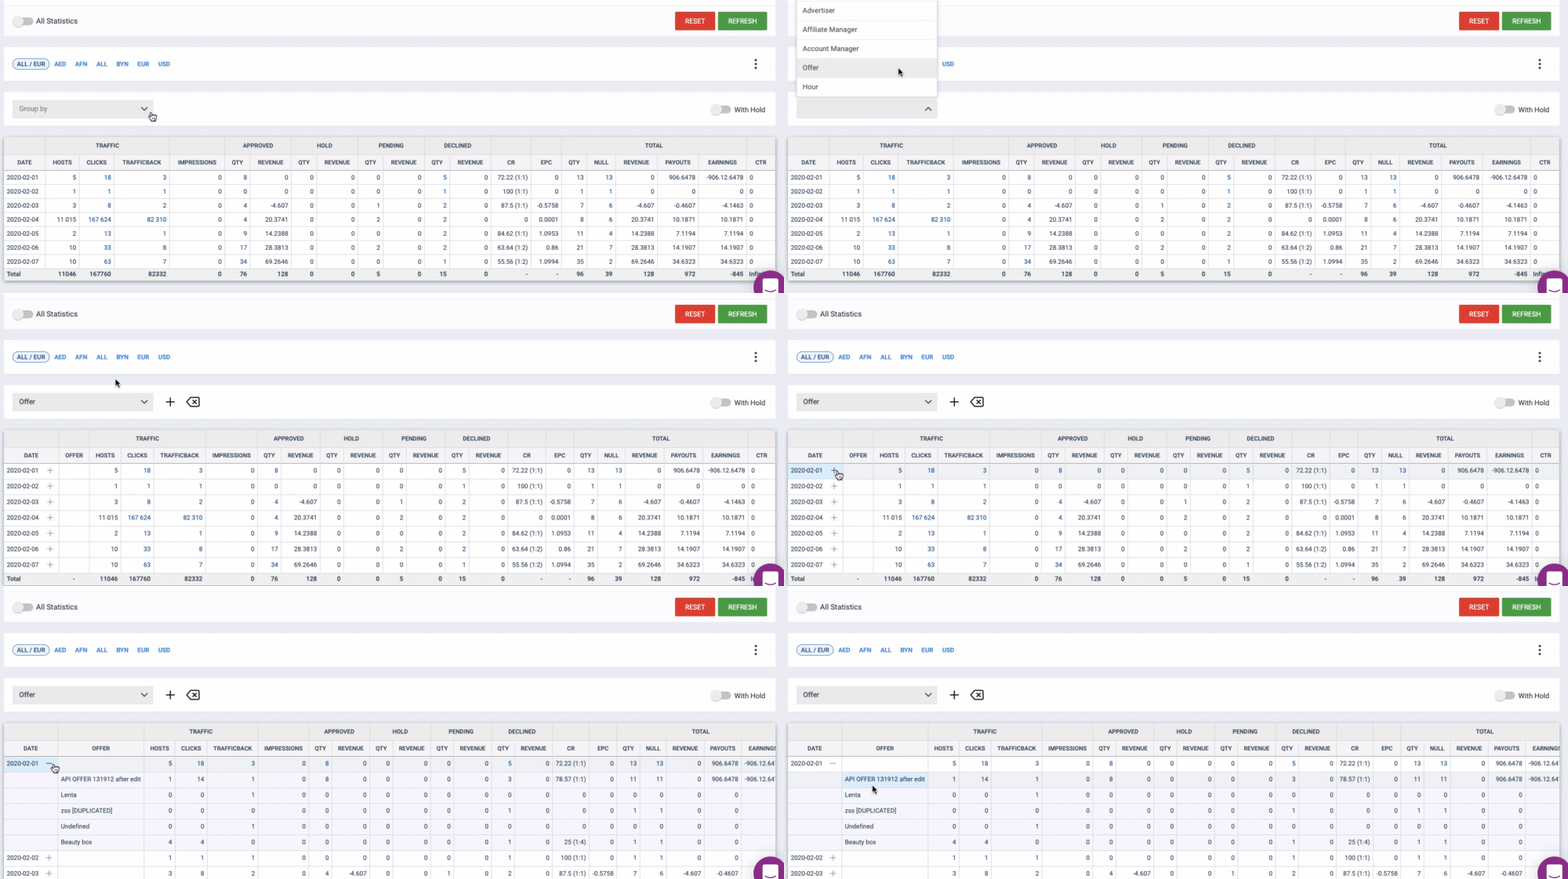
Put it simply, this technique allows having several reports within one page.
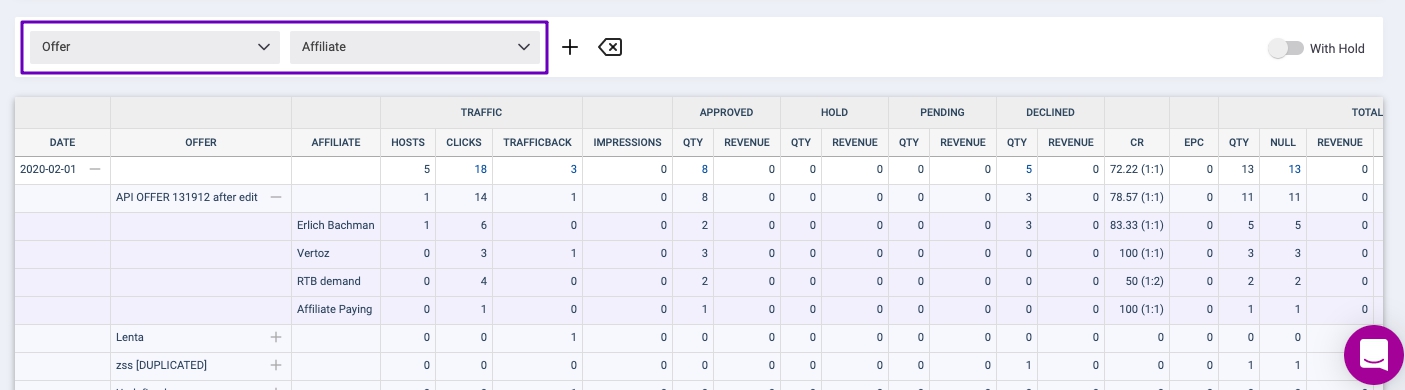
Default Order Update
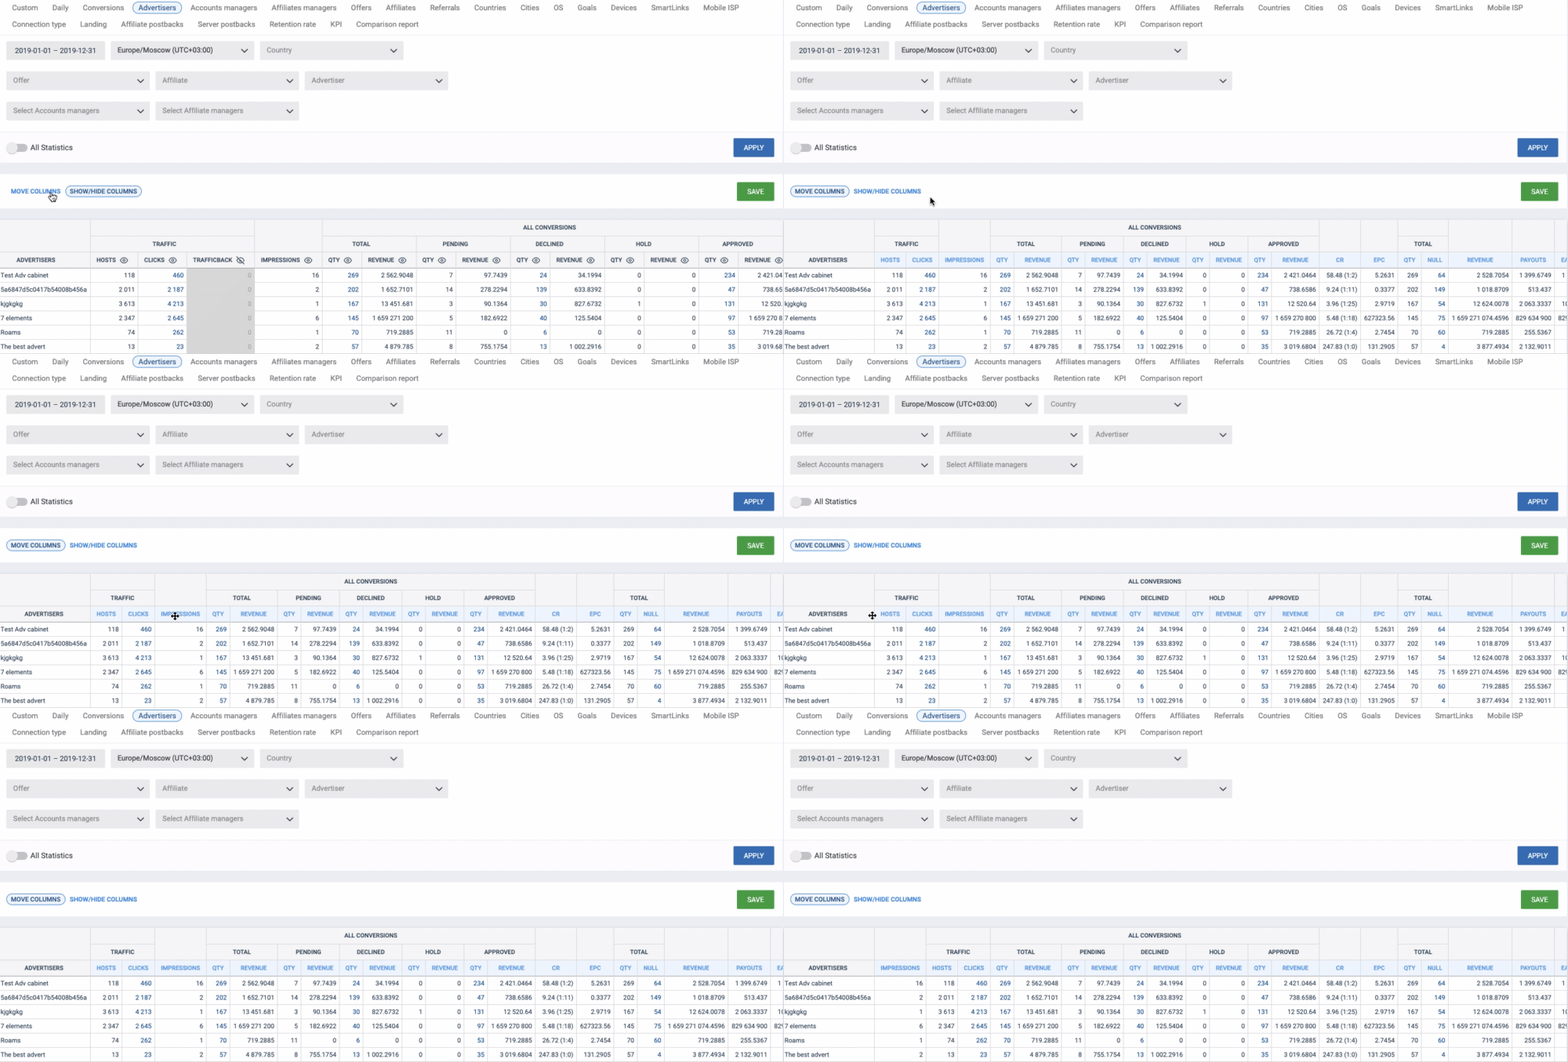
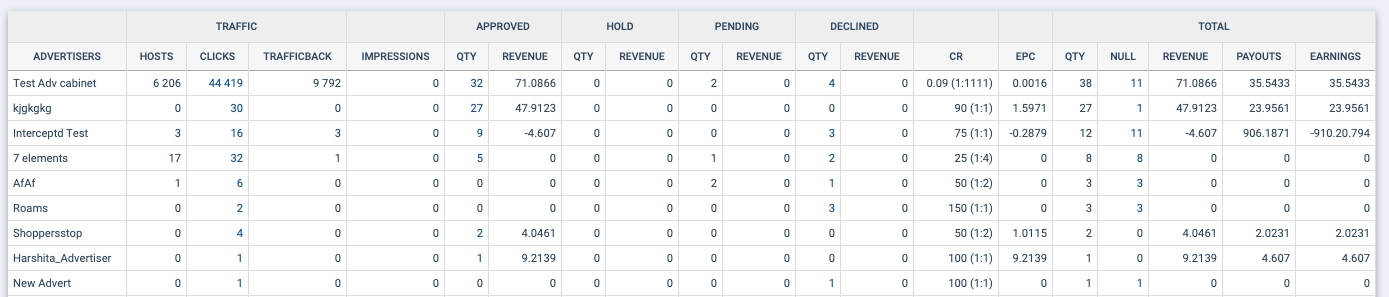
We simplified the table by removing one headline and Total columns (Conversions part) and changing the order in the Conversions area.
Benefits of Affise’s Statistics Design for Different Verticals
Affise is the first performance marketing platform that meets the needs of players from different verticals. New features of the statistics section provide marketers from different niches with all required KPIs and allow them to get rid of all unnecessary metrics and numbers. Statistics customization is a significant step in the direction to make Affise an all-in-one platform for all the affiliate marketers.
All in all, the new design of Affise statistics allows marketers from any industry vertical to customize the workspace to their unique needs.
Frequently Asked Questions
1. How does Affise Statistics customization help marketers focus on the most important KPIs?
Affise Statistics customization allows marketers to hide unnecessary columns, change their order, and focus the report on the metrics that are most relevant to their campaigns. The Calculator widget also makes it possible to create new metrics and indicators using formulas directly within the Statistics section. This can be particularly useful when different business models or verticals require different KPIs. For example, teams can create metrics that combine several data points to better reflect their specific performance goals, as described in Affise Custom Columns. This approach reduces the need for manual calculations and keeps important performance data in one place.
2. What are drilldown reports in Affise Statistics?
Drilldown reports allow marketers to break down statistics using multiple data groupings and additional parameters within a single report. This makes it possible to examine campaign performance from different perspectives without creating separate reports for every dimension. For example, marketers can analyze performance by affiliate, offer, advertiser, or other relevant parameters to identify patterns and differences in their data. This type of detailed analysis can be complemented by Affise’s Events report for tracking conversions and user behavior, which provides additional insight into user journeys and event-level performance. Together, these reporting capabilities can help teams move from high-level performance monitoring to more detailed analysis.
3. How can customized statistics and dashboards improve affiliate performance analysis?
Customized statistics and dashboards help teams organize performance data around the metrics and views they use most frequently. While the Statistics section allows users to adjust columns, create calculated metrics, and build drilldown reports, dashboards can provide a broader visual overview of important performance indicators. Affise Custom Dashboards support different visualization formats, including tables, line charts, bar charts, and pie charts, and allow teams to share dashboards with other users. You can learn more about these visualization capabilities in Affise Custom Dashboards. Combining customized reports with visual dashboards can make recurring performance analysis more structured and accessible for different members of an affiliate marketing team.